
One of the first things I do when reversing a game is look for any debug features. These can give valuable information that can help you understand the game more closely.
When searching for debug features in Fallen Earth I noticed there was a lot of string formatting with information that I would like to observe. Here’s one with player position and direction.

Following it in memory I found a very large function with more debug strings below and above the player position string. Here’s one for virtual memory available.
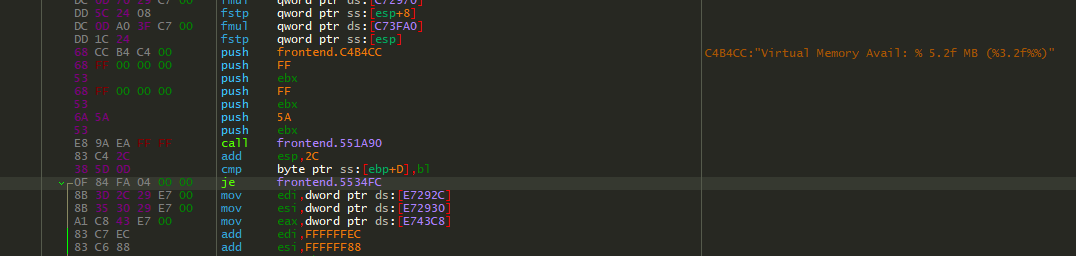
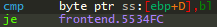
Notice before the jump it’s comparing the lowest byte in ebp to an offset at [ebp+D]. Going back to the beginning of the function we can see how ebp is loaded.
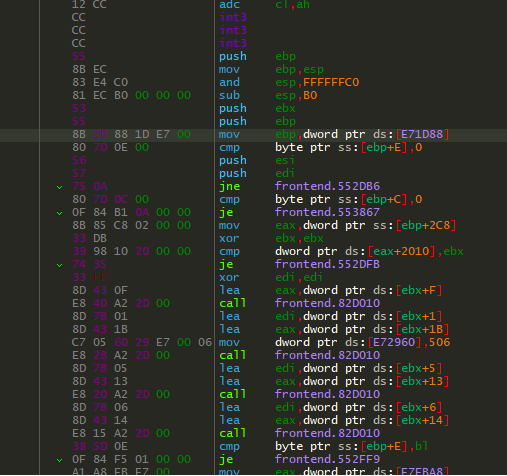
The address 0xE71D88 is loaded into EBP and then it’s immediately checked at offsets +E and +C for the value of 0. Changing the value of EBP+E to 1 will toggle some debug information on our game client UI.
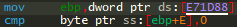
This specific debug information is not that valuable to me, but it tells me I’m on the right track to unlocking some developer debug displays. I comb through the function, using x64dbg’s highlight feature, to find all references to the address 0xE71D88 and any offsets being used on it.
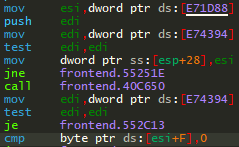
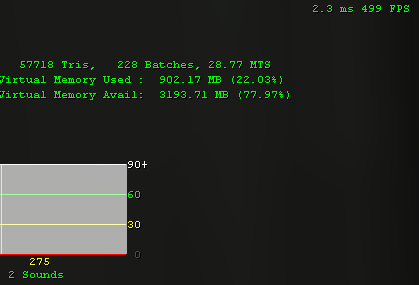
These four offsets are by default set to 0. Turning them all to 1, or on, will produce the following results on the game client UI.
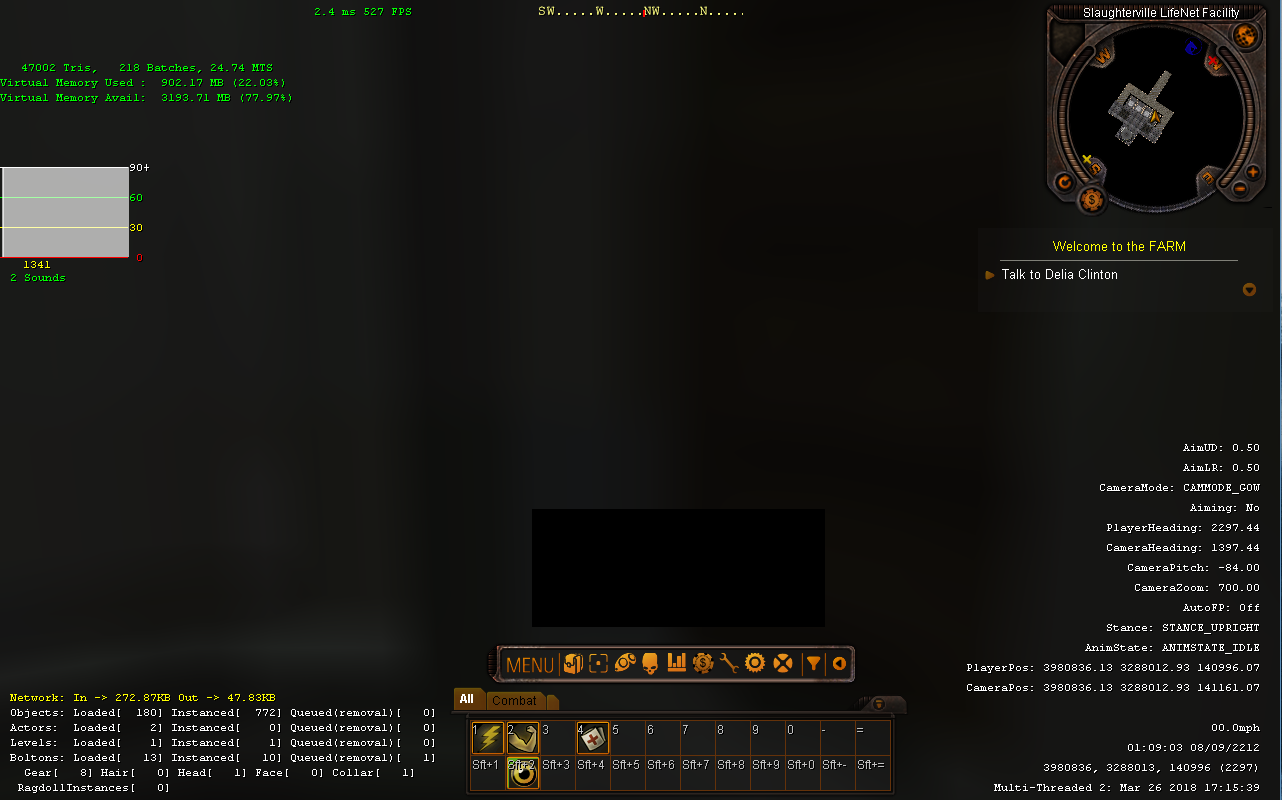
Now that I have all the debug information I could find displaying on my screen, I focus on the values that interest me most. In this case it will be the player speed which is displayed in the bottom right corner as mph, and the camera zoom which has a maximum value of 700.00.
Using CheatEngine I was able to find these values as I have a reference to their exact amount at any given time, making searching for them much easier.

